Bicycle Friendly Communities Program
The Bicycle Friendly Communities (BFC) program provides municipalities with advice and feedback, goal setting assistance, training programs and recognition awards to create more bike-friendly communities. It is a results-oriented program designed to encourage municipal decision makers to consider how their existing cycling programs complement one another and how they can be improved. Detailed feedback from transportation professionals and community stakeholders gives communities an accurate measure of where they are and a detailed roadmap to the future.
Background
Note: To minimize site maintenance costs, all case studies on this site are written in the past tense, even if they are ongoing as is the case with this particular program.
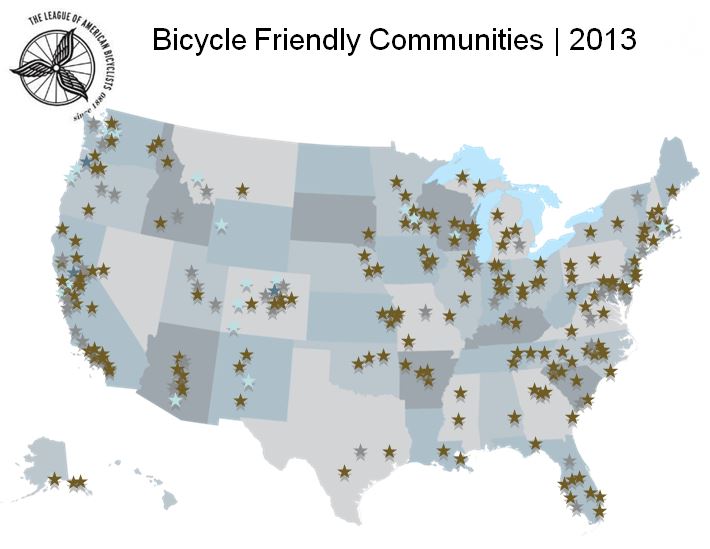
This case study profiles the international Bicycle Friendly Communities (BFC) Program, using as an example its spread into Canada. The BFC program was started in the United States by the League of American Bicyclists in 1996. Bill Nesper, the League's Vice President of Programs, said that at the time, the application form had only three questions and set a very low bar. “We had only one award level and as you can imagine, the list of municipalities quickly got very large."
The application form was updated in 2002 and the League assembled a panel of experts from around the country to assess applications. In 2002, the League added five award levels and developed a more in-depth application form.
In 2010, the BFC program was brought to Ontario, Canada by the Share the Road Cycling Coalition, in partnership with the League.
Since then, the program has motivated lasting change at the municipal level. Municipalities have used every aspect of the program to increase cycling’s profile within their communities, resulting in significant changes in how cycling is considered as part of a municipality’s transportation network.
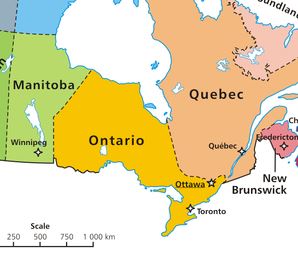
Map courtesy of Wikipedia
Setting Objectives
The program's objectives in the USA and Ontario were to maintain consistent, incremental growth in cycling as a mode share, and improve the conditions for cyclists.
Getting Informed
The League’s past experience, expertise and resources were invaluable in establishing the Ontario program, as were the strong connections and relationships made between Share the Road and Ontario municipalities and community organizations in previous years.
Share the Road staff recognized that, in many cases, municipalities were missing several key pieces of cycling information. For example, they often didn’t have a full account of their assets, were unsure where to go next, or didn’t know what other municipal departments or community groups were working on cycling issues.
Before launching the program, staff recruited municipal transportation experts to get a sense of the issues facing Ontario municipalities; these experts later became members of the program's panel of judges.
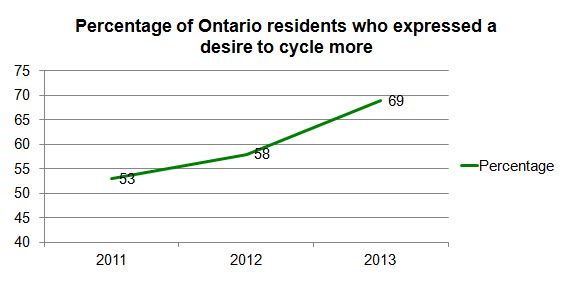
Polling data from between 2010 and 2013 indicated that the pent-up demand for cycling in Ontario was very strong and growing. In 2001 54% of residents said they would like to cycle more, 58% said so in 2012, and 69% said so in 2013.
Delivering the Program
The BFC program was developed using the 5Es:
- Engineering: The physical infrastructure and hardware that supports cycling, such as bicycle lanes and trails, secure bike parking, automated counters, etc.
- Education: Information and training that supports municipalities and cyclists.
- Encouragement: Programs to promote cycling; recognition for municipal actions, etc.
- Enforcement: Ensuring that laws, bylaws and signage recognize cyclists' rights and responsibilities, and their vulnerability on the road.
- Evaluation & Planning: Measurement and tracking procedures to ensure that communities understand their progress.
To launch the program, staff started sending a monthly newsletter to more than 5,000 recipients advertising the program.
Each municipality that applied for the program completed a thorough, 90-question application form that assessed each aspect of the 5Es. Justin Jones, the BFC’s program manager, said that it typically took about 10 hours of staff time to fill it out. "It took time for staff people to track down the kind of data they needed, such as the total mileage of their street network or their bike lanes, or who was doing what programming." (Obtaining a commitment)
He also explained that the form was devised to require deep collaboration with several municipal departments.
“We wanted applicants to bring in partners and collaborators throughout their communities so that they could start to build relationships that would let them leverage the programs they already had (such as road design, in-school safety programs, trail maintenance, and cycling promotion days), make them stronger, and ultimately make their communities more bike friendly.”
Each municipality’s application was reviewed by local reviewers (a range of community stakeholders identified by Share the Road and the municipality), who provided feedback on the application specifics and ensured that the information provided was correct.
“We couldn’t be everywhere in Ontario so we relied on local reviewers to give us in-depth, on-the-ground, practical feedback that we could use to provide helpful feedback forms to communities after they’d applied,” said Jones.
Applications were then assessed by a panel of expert judges (including engineers, public health and municipal officials) that took into account the local reviewer feedback and their own knowledge of each community.
“The reviewers provided us with a snapshot of what conditions were actually like, while our panel of judges spoke to the infrastructure and other issues,” said Jones.
The entire feedback process was designed to inspire further action in a community by providing it with examples of other BFC-certified communities and offering a suite of programs, projects and policies that would make cycling safer in the community. (Feedback, Norm Appeals, Building Motivation over Time)
Applicants received feedback in the form of a detailed 12-page report and a one-page report card. The in-depth report was intended for municipal staff, while the report card was meant as a “snapshot” for use by municipal politicians and senior managers.
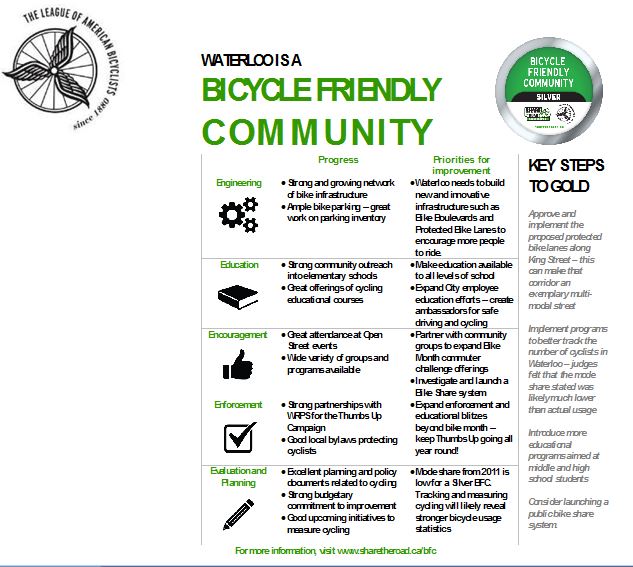
The report card provided a “snapshot” for municipal politicians and senior managers.
Based on all of the collected information (what the community was already doing and where it could improve) Share the Road designated successful applicants with a Gold, Silver or Bronze BFC certification, or with an Honorable Mention.
BFC-certified communities were linked to programs, training opportunities and local organizations to further advance their programs. They also received periodic communications that provided information about new BFC programs, projects and policy updates.
“We built a community of BFCs to share best practices and discuss how innovative programs could be replicated in other communities,” said Jones. “In this way, the BFC program served not only as an assessment and recognition tool, but also as a capacity-building tool at the municipal level.” (Building Motivation over Time)
BFC certification lapsed after four years, after which communities were required to reapply. “That’s an appropriate timeline for municipalities to see results from the investments they made,” said Jones. (Building Motivation over Time)
Overcoming barriers
One of the main barriers to improving cycling at the community level in Ontario was a silo approach to transportation issues.
Jones explained: “The engineers that designed the roads weren’t talking to the planners designing the communities; the public health agencies that designed active youth programs weren’t talking to the police that were running road safety programs; transportation demand management program managers weren’t able to effectively communicate the importance of reducing reliance on single-occupant vehicles."
The application form was designed to encourage interdepartmental cooperation, and also to weed out those who weren’t serious about improving cycling in their communities from those who were. (Overcoming Specific Barriers)
"If a community wasn't willing to put in the time to fill the application out well, they weren't ready to be certified," said Jones.
Once a community was certified, the inter-departmental relationships that had been created through the application process tended to facilitate a more collaborative process with regards to cycling moving forward.
“Many communities were surprised at the number of departments that were working on cycling in small ways, and that had worked collaboratively to strengthen existing programs and develop new ones,” reported Jones. “The changes were long-lasting. The culture in several communities had changed from seeing cycling as an afterthought to considering cycling at the earliest stages of all planning and programming decisions.”
Promoting the BFC
Share the Road staff attended several annual events organized by the Association of Municipalities of Ontario (AMO) to promote the program and encourage attendees to apply, as well as several rural municipal conferences. Additional marketing efforts and award presentations were also made at the Ontario Bike Summit, held in Toronto each year.
Recognition for BFC communities
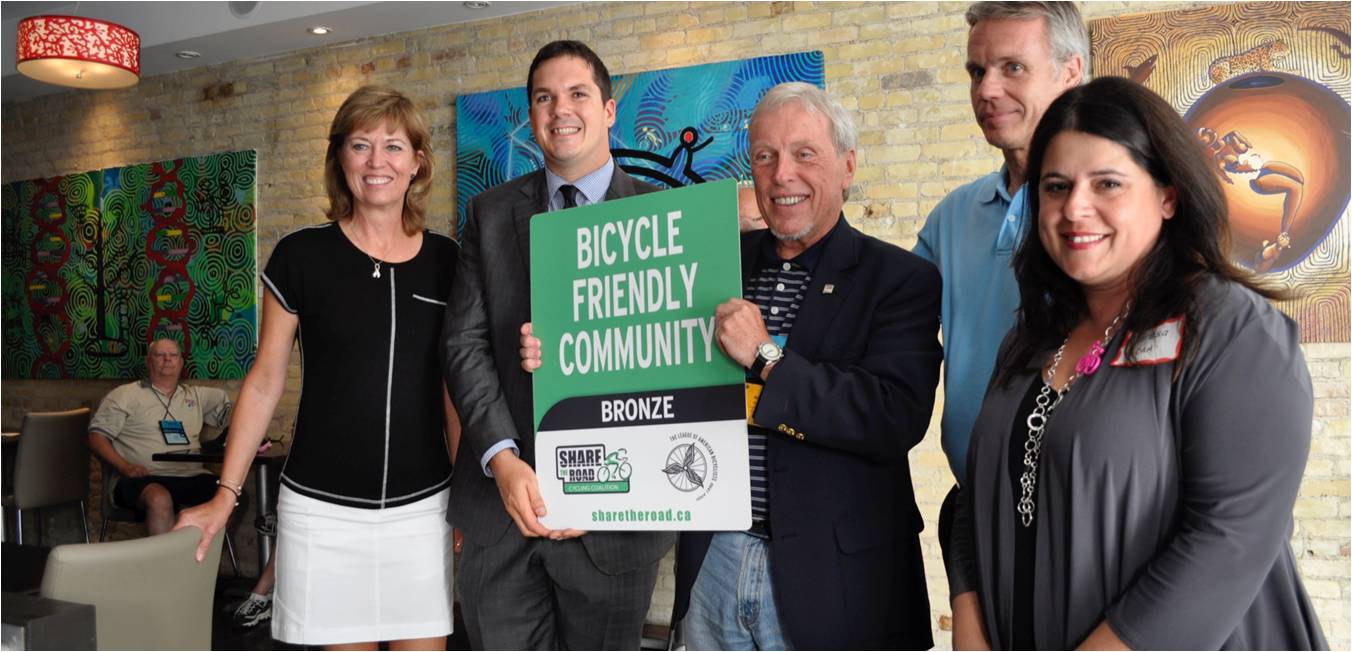
Share the Road made most BFC award presentations to the applicants’ municipal councils.
“We gave a short presentation on what the community had accomplished as well as the next three big things they could do,” explained Jones. “We then gave them their plaque and put out a media release and there was typically good media pick-up on it, especially in smaller municipalities.” (Building Motivation over Time)
Jones said that the BFC program was successful because it was results-oriented and focused on the positive.
“We provided municipalities and politicians with a pat on the back rather than a poke in the eye,” he said. “We focused on what they were doing right rather than what they were doing wrong. The program fed off of that competitive spirit. It was actionable, expert-driven feedback and we gave them very specific actions that were designed to get the municipality to become more bike-friendly.” (Building Motivation over Time)
The BFC program provided recognition to municipal staff and politicians.
Financing the Program
The League of American Bicyclists shaped the original program and provided resources and information that were used in the Ontario program.
The BFC program was offered for free to Ontario communities with support from sponsors Trek Bicycle Corporation, the Canadian Automobile Association, and Norco Bicycles.
Measuring Achievements
Program impacts were measured by assessing the number of Bicycle Friendly Communities across the province, and the average growth in cycling mode share in those communities relative to others.
BFC-certified communities tracked their progress using bicycle counters, the number of people using certain programs or products, and bicycle accounts (used to track the number of riders, their destinations, length and speed of trips, length, width and condition of bike facilities, and collisions and casualties, etc.).
Results
USA
The BFC program has run in the United States since 1996. By April 2015 there were 332 certified communities in all 50 states. Nesper reported that between 2000 and 2013 investments in bicycling infrastructure, education, encouragement, enforcement and better planning had grown 105%.
Between 2000 and 2010, cycling as a mode share grew, on average, by 47% in the U.S. as a whole. During this period, the growth of American BFC-certified communities was 80% - more than double the 32% of non- certified communities.
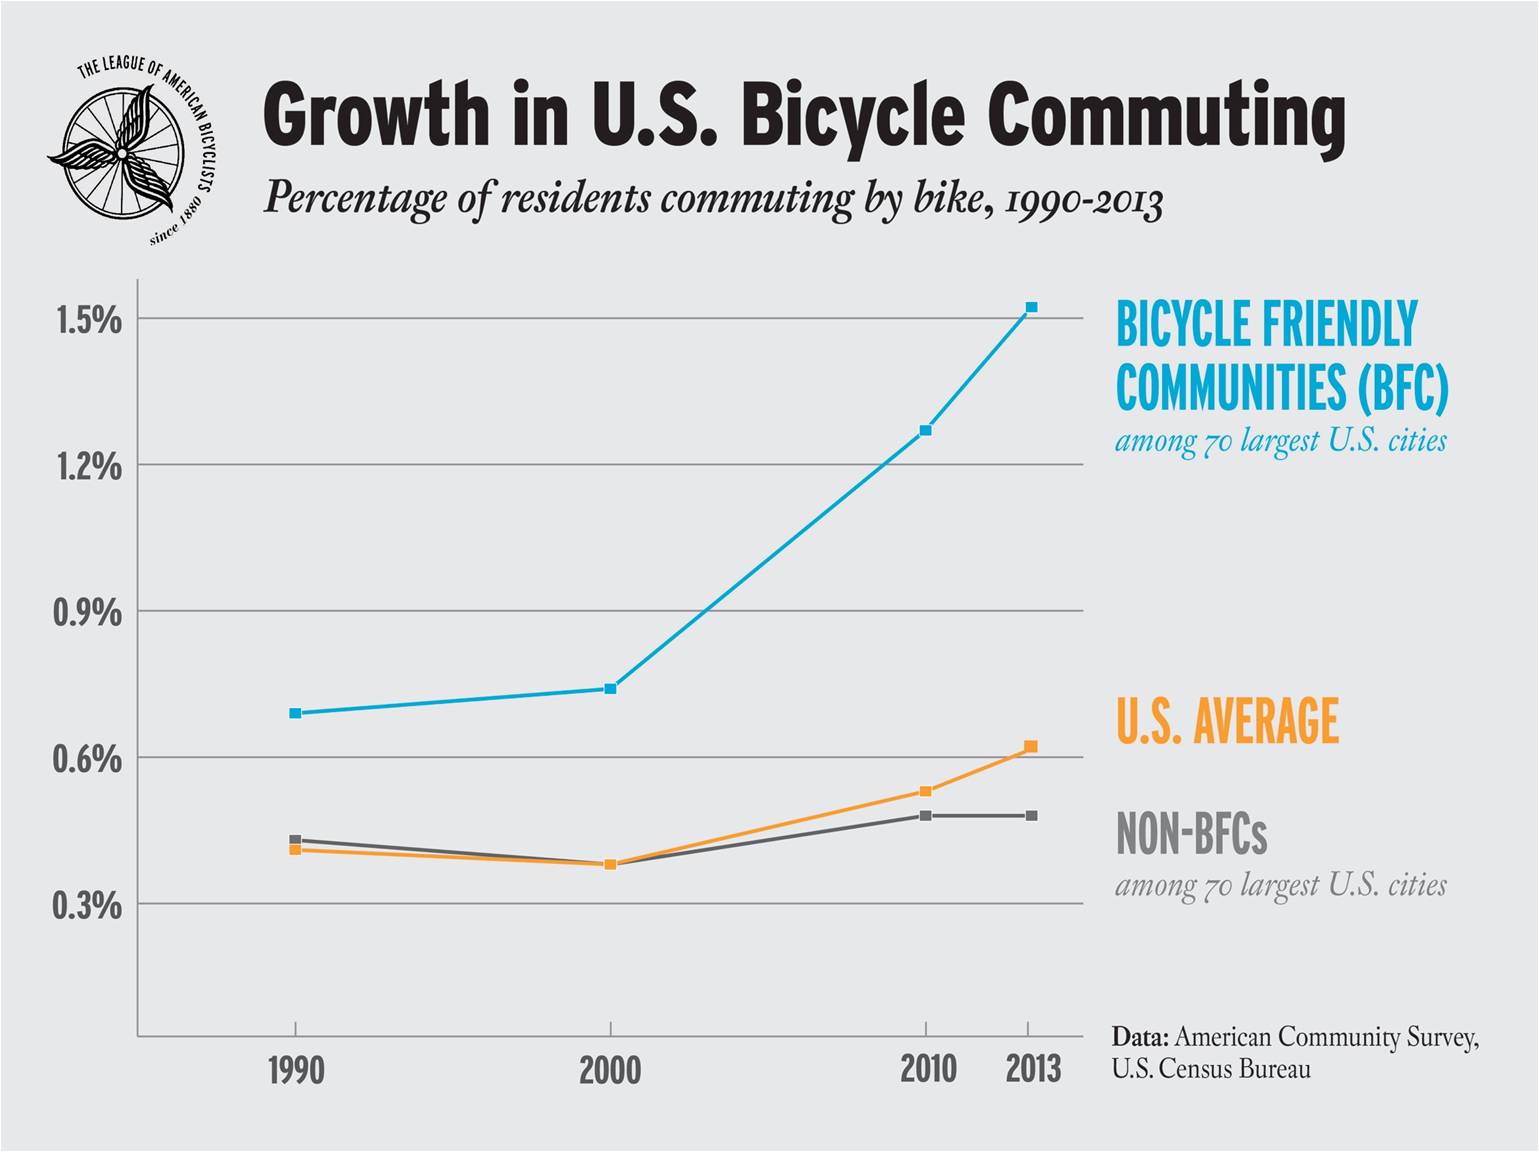
In Washington, DC the percentage of trips being made by bike nearly tripled from 2000-2011, going from 1.2% to 3.1%, an increase that coincides with Washington’s rise from no certification to Bronze in 2003 to Silver in 2011.
By 2013 four municipalities in the USA had reached platinum level, 18 had reached gold, 46 had reached silver, and 224 had reached bronze.
Canada
Jones noted that since the program was introduced in Ontario only recently it was still too early to see large changes in provincial modal share.
“There’s nothing concrete yet, except from municipalities like Toronto that do their own measuring,” Jones said. “Toronto has seen upwards of a 74% increase in cycling between 2011 and 2014.”
In 2014, 52 municipalities applied to the program, with 24 earning BFC certification. Of those, seven communities had moved up in designation level from 2010 (one Silver to Gold, two Bronze to Silver, two Honourable Mention to Bronze and two no award to Honourable Mention). All reapplying communities indicated that the feedback they received strongly informed their actions since their previous application.
“The communities that moved up leveraged the feedback we gave them," said Jones. "They took their connections and the new relationships they built and created new programs, projects and support for cycling within their communities.”
In 2014, Ottawa was the first city to receive a Gold certification, moving up from Silver in 2010. Its initiatives included the addition of over 10,000 bike parking spaces and 1,500 ring-and-post racks, 50% of city buses equipped with rack-and-roll mechanisms, approximately 350 km of bike lanes and paved shoulders.
To track and measure progress, by the spring of 2015, Ottawa had more than a dozen automated bicycle counters located around the city (data sets at: http://data.ottawa.ca/dataset/bicycle-trip-counters-automated), and two live, on-line counters (Portage Bridge and Laurier at Metcalfe). The city also tracked the number of reported collisions by time of day, location, fatalities and injuries, and the mode type (e.g. car, bicycle, pedestrian, and train).
Contacts
Notes
Lessons Learned
Promote internal collaboration
The application form was designed to be difficult to fill out well without the input of multiple municipal departments. “The communities that were the most successful were the ones that had done the application collaboratively with many different departments, and had maintained and strengthened the cross-silo relationships that were made during the completion of the application,” said Jones. Successful communities built cycling into their decision-making processes and levered the application into a broad, inter-departmental change in thinking.
Focus on the majority
Nesper said that in the League's experience, less than 6% of cyclists who say they have no fear of the road will always be fine; it's the rest of the population you need to focus on.
"The people who identify as 'interested but concerned' are 60% of the population," he said, "and they're the key to unlocking your community as a bike-friendly one."
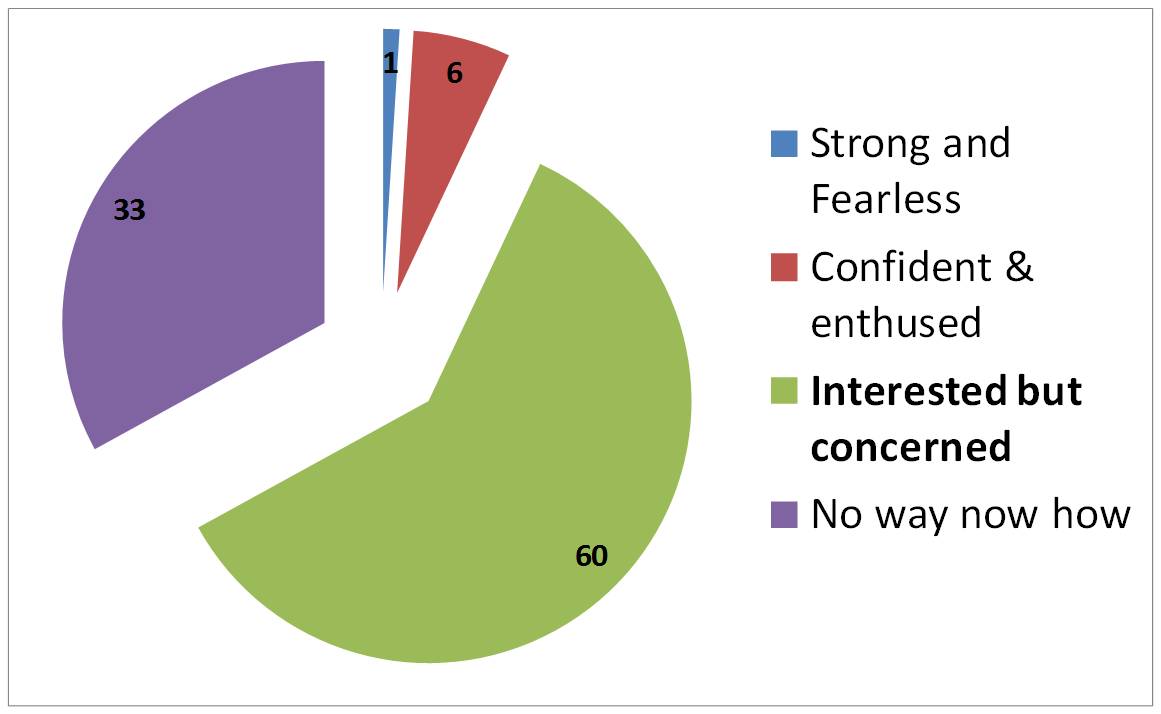
The 60% who identify as 'interested but concerned' are key to developing a bike-friendly community.
Friendly competition helps
“Municipalities are always in competition with one another to attract talent and press, so we really do see the spirit of friendly competition between municipalities who are in the program,” Jones said. The BFC used that spirit to inspire municipal staff to do more and encourage municipal political leaders to strive for a higher designation level.
Jones provided the example of Pelham, a small town in the Niagara region. “Pelham was our smallest Bike Friendly Community to be awarded Silver,” he said. “When they got their award, the number of phone calls I started getting from other Niagara region municipalities about what they could do to improve their Bike Friendly Community status was incredible. It really engendered the spirit of healthy competition and municipalities wanting to one-up their neighbour.”
Landmark Designation
The program described in this case study was designated in 2014.
Designation as a Landmark (best practice) case study through our peer selection process recognizes programs and social marketing approaches considered to be among the most successful in the world. They are nominated through an open nomination process and by our peer-selection panels and Tools of Change staff, and then scored by the selection panels based on impact, innovation, replicability and adaptability.
The panel that designated this program consisted of:
- Mark Dessauer, Blue Cross Blue Shield of North Carolina Foundation
- Ryan Lanyon, City of Toronto
- David Levinger, Mobility Education Foundation
- Patricia Lucy, Translink
- Jacky Kennedy, Green Communities Canada
- Nathalie Lapointe, Federation of Canadian Municipalities
- Geoff Noxon, Noxon Associates
- Chuck Wilsker, U.S. Telework Coalition
- Phil Winters, University of South Florida
Selected Comments from the Landmark peer selection panel
- Very effective at motivating and rewarding systemic change by municipalities. This is a proven approach for influencing upstream changes, including the behaviors of municipal staff and politicians (who may be key partners / secondary audiences when working to influence the citizens of their municipalities.)
- The approach of creating a valued designation and ‘certifying’ progress is very adaptable to a range of behaviors and easily replicated in different-sized municipalities
- Although individual impacts may be low to start with, the excitement that is built in communities as they boast about their designation, first to the cycling community, then to the broader community, can lead to positive individual impact over time.
- Gets all levels of participants involved
- Great partner integration
- This campaign is not anti-car but truly ‘share the road’
This case study was written in 2015 by Jay Kassirer and Sharon Boddy.

