
Tools Used
Initiated By
- City of Durham
Partners
- Duke Center for Advanced Hindsight
- North Carolina Central University
- RideAmigos
- Bloomberg Philanthropies
Results
- 2018: reduced City staff drive-alone trips by 9.3% (8.2% without the bus lottery)
- 2019: reduced student drive alone-trips by 7.2% (3.2% with fewer emails)
Downloads and Additional Details
- PDF of this case study
- http://www.citylab.com/transportation/2018/10/durhams-plan-to-nudge-drivers-out-of-cars/574264/
- http://advanced-hindsight.com/connect/
- http://waysandmeansshow.org/files/2019/03/S4E2-Transcript.pdf
- http://www.futurity.org/commute-transportation-2005232/
Way to Go Durham
This case study covers the formative research and pilot testing of the City of Durham’s Way to Go program with City staff and local university students. It illustrates the value of A/B testing and Randomized Control Trials for evaluating alternative program tactics. It exemplifies the effective use of personalized commute plans distributed en-masse and shows that they can have a substantial impact on travel behavior, even with no added incentives.
Background
The City of Durham, North Carolina wanted to reduce the number of single-occupancy vehicle (SOV) trips into its downtown area. This case study describes two pilot studies that Durham carried out in 2018 and 2019.
2018 Pilot Test
The City’s first round of program research in 2018 tested two strategies:
- Personalized commute plans (recommending alternative modes of transportation to work)
- Personalized commute plans combined with a bus lottery.
2019 Pilot Test
SmartTrip was also tested in a second pilot (2019) with 3,800 North Carolina Central University (NCCU) commuting students.
Getting Informed
2018 Pilot Test
For the 2018 pilot, the team started with four ideas that might change commuting behavior for Durham employees, based on behavioral science principles proven effective in other contexts. To iterate and develop these ideas, City staff and partner, Duke Center for Advanced Hindsight, gathered input from about 1,100 individuals with over 4,000 feedback opportunities through 10 feedback approaches.
Research methods included the following.
- Exploratory survey of residents regarding current transportation behaviors and interest in alternative incentives (N=617)
- Small, personalized route pilot (N=20)
- Feedback from mayor and City Council
- One-on-one interviews with residents (N>10)
- Focus groups with potential users and employers
From the exploratory learnings, the City narrowed ideas to two and pilot tested them with City of Durham employees.
2019 Pilot Test
For the 2019 pilot, the team conducted two preliminary surveys around communication and commuting habits with NCCU students, followed by user testing through a focus group and one-on-one interviews with students, behavioral science researchers, and transportation experts. Key insights from these prototyping activities further informed the program’s experimental design and pilot to reduce students drive-alone trips to campus.
Prioritizing Audiences
2018 Pilot Test: City employees
2019 Pilot Test: NCCU commuting students
Delivering the Program
2018 Pilot Test
In 2018 the team tested the following two assumptions through a Randomized Control Trial.
- SmartTrip: Providing people with personalized commute plans using alternative modes of transportation reduces the frequency with which people drive alone.
- Bus lottery: Offering people a chance to win a weekly $163 prize for riding the bus increases the attractiveness of transit and usage of the personalized commute plan.
To test these assumptions, 1,570 employees were randomized into three groups of equal size: a control, personalized commute plan (SmartTrip), and personalized commute plan plus bus lottery (Plus).
- The control group only received weekly surveys asking about their commute habits.
- In addition to these surveys, the personalized commute group received personalized commute plans, based on home and work addresses. Their emails also included trip time comparisons and listed the potential benefits of alternatives to solo driving (weight loss, gas savings, and reduced commute times.) The maps said, “Driving downtown is so 2017.” (Overcoming Specific Barriers; Vivid, Personalized, Credible, Empowering Communication)
- In addition to the above, the Plus group could participate in bus lotteries with a weekly cash drawing incentive for taking the bus. (Building Motivation, Engagement and Habits Over Time; Financial Incentives)
The timeline of this pilot was 5 weeks.
2019 Pilot Test
In 2019, the team tested the following two hypotheses to see if additional behavioral nudges further reduced the number of student trips.
- Receiving an invite to create a personalized route reduces the share of commute trips a student makes to campus by driving alone.
- Further enhancing the personalized route and sending follow up emails offering eligible students further transportation-related services (incentives to track trips, carpooling options, transportation consultations) further reduces the share of commute trips a student makes to campus by driving alone.
To test these two hypotheses, 3,797 students were randomized into three groups.
- The control group only received weekly surveys asking about their commute habits.
- In addition to these surveys, the SmartTrip group received the individualized commute email (SmartTrip). (Overcoming Specific Barriers; Vivid, Personalized, Credible, Empowering Communication)
- In addition to the above, the SmartTrip Plus group received emails with transportation service offerings and updates on parking enforcement. (Building Motivation, Engagement and Habits Over Time)
The timeline of this pilot was 12 weeks.
Overcoming Barriers
The following table lists the key barriers to action and how they were addressed. (Overcoming Specific Barriers)
|
Barrier |
How it was addressed
|
|
Reliance on car, do not know how to get to work or campus without a car |
Personalize commute plan (SmartTrip) Pilots 2018 and 2019 |
|
Perceived inconvenience of the alternatives |
Incentives like financial reward (bus lottery) Pilot 2018 |
|
Lack of salience of alternative commute options |
Personalized commute plan (SmartTrip) Pilots 2018 and 2019, biweekly communication emails Pilot 2019 |
|
Lack of salience of the benefits of alternative mode use |
Personalized commute plan (SmartTrip) message framing (centered around financial savings, enforcement avoidance, and incentives) Pilot 2019 |
Measuring Achievements
Both pilots were structured as Randomized Control Trials (RCTs). Outcomes were compared across control and treatment groups. This provides a higher degree of certainty of the impacts, by controlling for non-program influences (i.e. eliminating the ‘noise’ from non-program factors.)
2018 Pilot Test
With the 2018 pilot design, the team tested two assumptions to see if commuter behavior could be changed. To test these assumptions, 1,570 employees were randomized into three groups: a control, personalized commute plan (SmartTrip), and personalized commute plan and bus lottery (Plus).
The team measured the effectiveness of this pilot through:
- Pulse surveys – employees self-reported their commuting behaviors on a weekly basis
- Evaluative survey – final survey conducted at the end of the pilot period
- Transit data – tracking individual GoPass (bus pass) usage
2019 Pilot Test
With the 2019 pilot design, the team tested two hypotheses using the SmartTrip to see if the SmartTrip plus additional behavioral nudges reduced the number of trips a student made to campus by driving alone.
For this pilot, the team relied on
- Pulse surveys - – students self-reported their commuting behaviors on biweekly basis
- GoPass usage
- Trip-tracking data
- Parking permit purchases
- NCCU commuter program participation
In addition, aggregate stats were collected regarding open and click rates for all communications delivered. In examining results, external, influencing factors were controlled for (such as student level and prior experience using transit).
Results
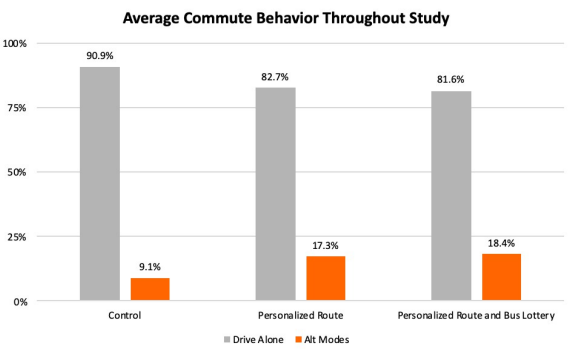
2018 Pilot Test
Relative to the control group, the average proportion of drive alone trips was 8.2 percentage points lower for those who received the personalized route and 9.3 percentage points lower for people who received the personalized route and bus lottery. Both comparisons were statistically significant (p>0.05) and this reduction held for the five-week study period. While this study is by no means the final word on the use of personalized commute plans, reasonably consistent findings across data collection methods and over time indicate that the personalized commute leads to at least a moderate decrease in drive alone trips. * Please see the linked pilot plan reports for study and data limitations, etc.
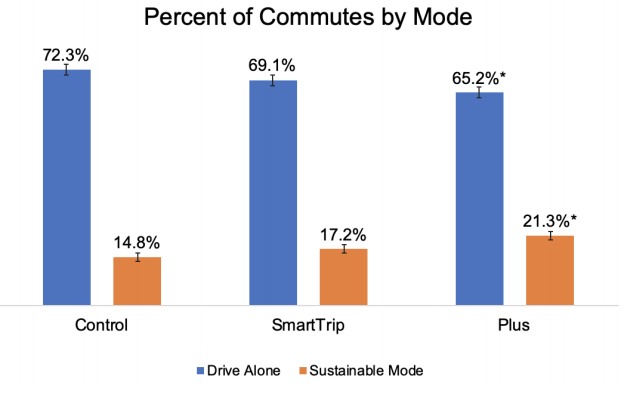
2019 Pilot Test
Relative to the control group, when averaged by individuals across all five self-report surveys delivered over 12 weeks, the percentage of drive alone trips was 3.2% lower for those in the SmartTrip group and 7.2% lower for those in the Plus group. The difference in the drive alone rate of the Plus group compared to the control is statistically significant (p=0.03). * Please see the linked pilot plan reports for study and data limitations, etc.
Because very few students participated in the RideAmigos trip tracking or commuter consultations to earn incentives, the added effect in the Plus condition is likely centered around the added communications.
Notes
- This case study illustrates a practical method of testing the impacts / value of alternative tactics.
- Few Individualized Marketing programs provide personalized trip maps without incentives. This case study shows that individualized trip maps can have a substantial impact on travel behavior, even with no added incentives.
- The 2019 pilot illustrates the value of offering additional transportation services and updates on parking enforcement.
- This is a good example of the importance of personalizing communications. While other behaviors may not involve travelling, most nonetheless involve a “customer journey” that can be presented graphically and in a personalized manner in a small number of relevant best options.
- This case study also highlights that partnerships can exist across public (Durham), private enterprise (RideAmigos), nonprofit (Bloomberg Philanthropies), and academic organizations (Duke Center for Advanced Hindsight and North Carolina Central University). Each enterprise contributed its expertise and resources to solve TDM problems that are common to other cities, businesses, and universities. This partnership enabled the core team to prototype, test and then share promising solutions with other enterprises at a faster pace.
- Iteration and replication of the personalized commute plan tool (“SmartTrip”) with the RideAmigos commute platform, has enabled personalized commute plans to be distributed en-masse.
Search the Case Studies