Chicago’s Building Energy Rating System
Chicago was the first U.S. city to require building owners to prominently post a building’s energy performance rating, and to share that that rating with potential buyers and/or renters. While the rating system was being introduced, ComEd and Peoples Gas ran extensive complementary incentive and rebate programs that enabled building owners and managers to make energy improvements at little to no cost. From 2017 to 2020, this program saved 7,293.6 million Btu (2.1 million kwh) per year. Designated a Landmark case study in 2022 by our climate change peer review panel, and in 2024 by our building energy panel.
Background
Note: To minimize site maintenance costs, all case studies on this site are written in the past tense, even if they are ongoing as is the case with this particular program.
The City of Chicago had committed to the goals of the Paris Climate Agreement, including a 26-28% reduction in greenhouse gas emissions by 2025. Energy use in buildings represented over 70% of the City’s greenhouse gas emissions, and the City had to improve energy efficiency in buildings to meet its long-term climate goals.
Chicago was the first U.S. city to require building owners to prominently post a building’s energy performance rating, and to share that that rating with potential buyers and/or renters. Energy benchmarking can help identify opportunities to reduce energy use and save on utility bills. Starting in 2013, Chicago required buildings over 50,000 square feet (sq. ft.) to report energy use annually, and to verify the data every three years. The City started with its largest buildings, and all required building had to report by 2016. Then, in 2019, it introduced the Chicago Energy Rating System, which made energy use information for large buildings easily accessible to residents, while encouraging energy savings.
The program targeted the owners/potential buyers/ potential renters and building managers of about 3,600 buildings in Chicago bigger than 50,000 square feet. It encouraged building owners and managers to identify and address opportunities to reduce energy use and associated greenhouse gas emissions. It encouraged potential buyers and renters to choose buildings that were more energy efficient and created fewer greenhouse gas emissions.
Getting Informed
Formative research indicated that additional visibility and transparency of ratings could improve performance. For example, restaurants in New York City were required to post grades of A, B, or C, based on their health inspections. The number of restaurants receiving an A grade on initial inspection increased by 14% in the 18 months after the city required restaurants to start posting their grades.
Research also indicated that increasing the ENERGY STAR score by just 10 points per building could reduce energy use by about 8%, weather normalized.
Delivering the Program
The original Chicago Energy Benchmarking ordinance (2013) allowed the City to share buildings’ ENERGY STAR scores and other metrics publicly. Starting that year, the city required buildings over 50,000 square feet (sq. ft.) to report energy use annually, and to verify the data every three years. The primary intent was to boost visibility and transparency of information that was already publicly available; there were no new reporting requirements, and no new costs directly associated with the updates. The City started with its largest buildings, and all required building had to report by 2016.
Property owners or their representatives received their first rating placards in the fall of 2019. After an initial grace period of six months, property owners were required to post their placards, and to share their ratings at time of listing the property for sale or lease. Owners continued to receive updated rating placards on an annual basis and were required to post and share them.
Energy Scores
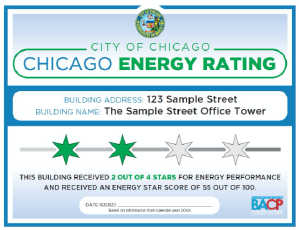
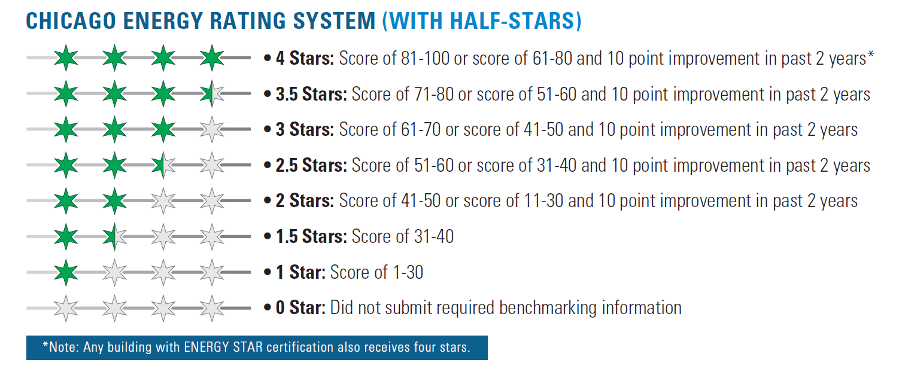
Chicago’s star system was based on the EPA’s Energy Star scoring system, which compared a property’s overall energy performance to similar building types in the USA, taking climate into account. A score of 50 indicated median energy performance, higher scores (up to 100) showed high energy performance, and lower scores indicated significant opportunities for improvement.
In addition, Chicago’s system gave each one-, two-, or three-star property an extra star if it made a 10-point improvement.
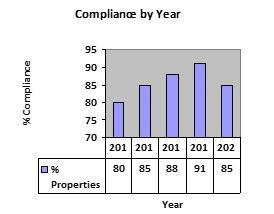
Compliance with the Chicago Energy Benchmarking was generally high, although numbers dropped slightly during the COVID-19 pandemic. A survey of noncompliant buildings at the time found some teams shifting their focus to other priorities or having more difficulty engaging with building owners/managers. In 2020, 2,841 properties spanning over 720 million sq. ft. reported energy use, an 85% reporting rate. In 2019, the reporting rate had been 91%.
In 2019, multi-family housing represented 48% of the total space being reported and 32% of total energy use. The next largest user, office space, represented 28% of total space and 21% of total energy use. Healthcare was next at 13% of total energy use and 5% of total space. Other sectors analyzed included lodging (9% of total energy use), retail (4%), college/university (4%), k-12 schools (1%), and other (16%.)
Water Use Reporting
In 2019, the city began including water use information. Building owners didn’t need to gather and report water usage data, as city’s Department of Water Management and Department of Finance were already collecting the data. Owners could opt out of having this information shared publicly.
Incentives and Rebates
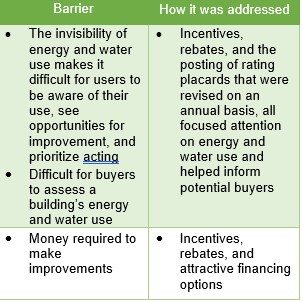
Extensive incentive and rebate programs, available from ComEd and Peoples Gas, enabled building owners and managers to make energy improvements at little to no cost. ComEd and Peoples Gas programs also offered advice to nonprofits, houses of worship, and affordable housing facilities.
Attractive Financing Options
In addition, Chicago began offering Property Assessed Clean Energy (PACE) in 2019, a voluntary low-cost financing opportunity for energy efficiency and renewable energy improvements. PACE was a particularly attractive choice for building owners that did not have the upfront funds needed to implement larger scale projects. PACE made it possible for owners and developers of commercial and multifamily properties to obtain low-cost, long-term financing for energy efficiency, sustainability and renewable energy infrastructure installed in new or existing buildings.
PACE was based on legislation that classified energy efficient and/or renewable upgrades as well as new installations at or above-code as a public benefit. Up to 100% of the “energy improvements and associated soft costs (permitting, structural support, etc.) could be financed with no money down and then repaid as a benefit assessment on the property tax bill over a term that matched the useful life of improvements (often as long as 20-25 years). What made this attractive is that the financing was based on the anticipated energy cost savings the building owner could expect to experience once improvements were installed. The financing offered a fixed interest rate, and projects typically had a net positive cash flow beginning in the first year. An additional advantage was that the assessment transfered on sale to the new owner.
PACE was available to the following types of properties:
- Commercial and industrial properties
- Multifamily residential apartment buildings or cooperative housing properties with five or more units
Measuring Achievements
- Participants had to report total energy and floor space annually and verify the data every three years.
- The city was already collecting water use data for each property.
Results
Emissions and Energy Use
- From 2016 to 2020 alone, the median carbon emissions per ft2 (GHG Intensity) for reporting buildings fell by 25%, while median energy use per ft2 (Energy Use Intensity) fell by 7%, adjusted for yearly weather differences. This helped counteract the growth in square feet used.
- From 2016 to 2020 alone, each property saved on average 1,167 kwh.
- Most properties continued to improve energy efficiency and achieve savings opportunities, even after multiple years of required energy benchmarking, which went into effect for all properties over 50,000 sq. ft. in 2016.
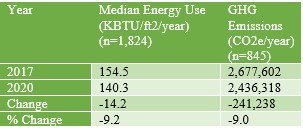
- In all, Chicago properties required to benchmark saw a reduction in energy use per ft2 of 9.2% from 2017 to 2020. This represents 7,293.6 million Btu saved per year or 2.1 million kwh overall per year.
- The median weather-normalized source energy use per sq. ft. for all reporting buildings dropped by 7% from 2016 to 2020. All sectors saw decreases since 2016, except for Retail and College/University. The greatest improvements were in the Lodging (18% improvement) and Office (15% improvement) sectors.
- In 2020, the median ENERGY STAR score for all analyzed properties in Chicago was 60 out of 100, an increase of three points from the median of 57 in 2019. It is difficult to compare data from the previous three years because the EPA updated its performance metrics in 2018, due to technical platform updates within Portfolio Manager meant to periodically update the benchmarks used for scoring.
- Properties that received a score of 75 or higher and met other criteria could earn an ENERGY STAR label. In Chicago, the number of ENERGY STAR certifications continued to rise. As of 2020, 192 properties subject to the energy benchmarking ordinance had been certified, up from 142 certified properties in 2016.
Water Use
- Based on data reported by the city for buildings required to benchmark in 2020, average water use intensity across all buildings was 25.9 gallons per ft2., down from 26.2 gallons per ft2 in 2019.
Notes
A similar approach could be applied to buildings throughout the world.
The overall idea – of making a seller provide information on particular achievements – for example, regarding energy and water use, can be applied to a range of products and services from cars and trucks to train and plane rides. It can also be applied to healthy environments (e.g. air quality measures), healthy products (e.g. alcohol, THC or nicotine content) and safety (safety record.)
Author and Landmark Designation
This case study was written by Jay Kassirer in February, 2023. The program described in this case study was designated by our Climate Change panel in 2022, and by our Building Energy panel in 2024. Designation as a Landmark (best practice) case study through our peer selection process recognizes programs and social marketing approaches considered to be among the most successful in the world. They are nominated both by our peer-selection panels and by Tools of Change staff, and are then scored by the selection panels based on impact, innovation, replicability and adaptability.
The Climate Change panel that designated this program consisted of:
- Kathy Kuntz, Dane County Office of Energy & Climate Change
- Doug McKenzie-Mohr, McKenzie-Mohr Associates
- Britta Ng, City of Coquitlam
- Susan Schneider
- Brooke Tully
The Building Energy panel that designated this program consisted of:
- Arien Korteland, BC Hydro
- Kady Cowan, Sustainability Studio
- Sea Rotmann, Sustainable Energy Advice Ltd.
- Lester Sapitula, Pacific Gas and Electric Company
- Reuven Sussman, American Council for an Energy-Efficient Economy

